1 Abstract
In this experiment, we followed the European Pharmacopoeia 8.0 Heparins, low-molecular-mass standard, Identification C: Size-exclusion chromatography requirements, and used molecular size chromatography to detect the molecular weight and distribution of enoxaparin sodium using a BioCore SEC-150HP chromatographic column. The results showed that the determination result of Enoxaparin sodium CRS in this experiment was 4397Da (4367±150Da), and the actual sample test results are shown in Table 4, which meet the pharmacopoeia requirements.
2 Overview
Salts of sulfated glycosaminoglycans having a mass-average relative molecular mass less than 8000 and for which at least 60 percent of the total mass has a relative molecular mass less
than 8000. Low-molecular-mass heparins display different chemical structures at the educing, or the non-reducing end of the polysaccharide chains.
Low-molecular-mass heparins are obtained by fractionation or depolymerisation of heparin of natural origin that complies with the monograph Heparin sodium (0333) or Heparin calcium (0332), whichever is appropriate, unless otherwise justified and authorised. For each type of low-molecular-mass heparin the batch-to-batch consistency is ensured by demonstrating, for example, that the mass-average relative molecular mass and the mass percentage within defined relative molecular-mass ranges lower than 8000 are not less than 75 per cent and not more than 125 per cent of the mean value stated as type specification.
3 Experimental Method
Test solution. Dissolve 20 mg of the substance to be examined in 2 mL of the mobile phase.
Reference solution. Dissolve 20 mg of heparin low-molecular-mass for calibration CRS in 2 mL of the mobile phase.
Mobile phase: 28.4 g/L anhydrous sodium sulfate
Flow rate: 0.5 ml/min
Column temperature: 30℃
Detector: Differential Refractive Index Detector
Injection volume: 25 μL
Chromatographic column: BioCore SEC-150HP, 5μm, 7.8×300mm.
4 Experimental Results
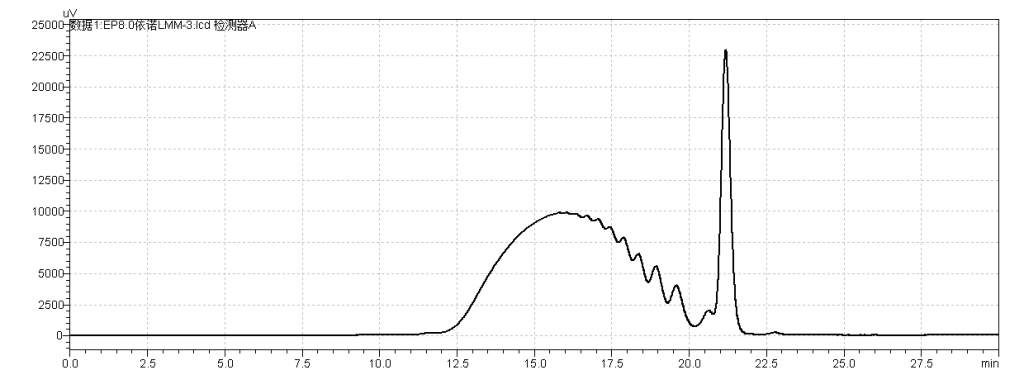
fig.9.Chromatogram of heparin Low-Molecular-Mass for calibration CRS
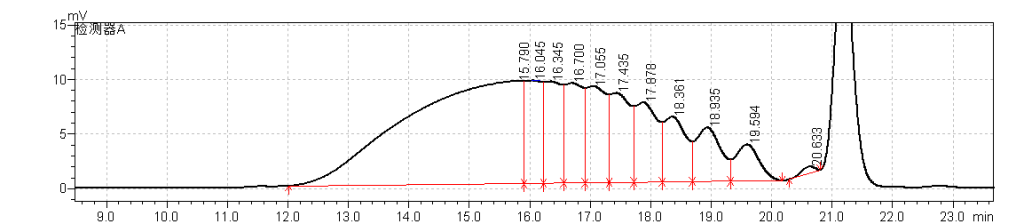
fig.10. Chromatogram1 of heparin Low-Molecular-Mass for calibration CRS
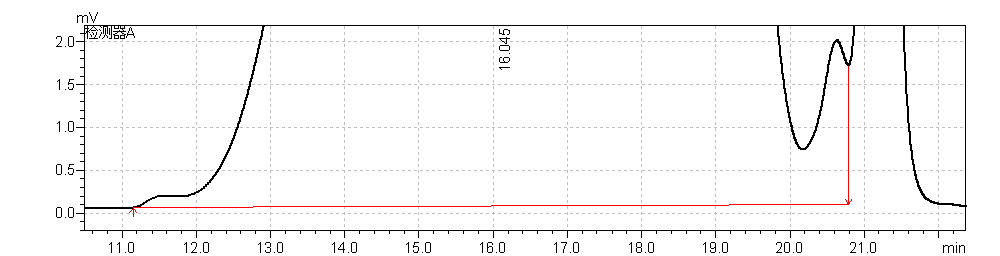
fig.11. Chromatogram 2 of of heparin Low-Molecular-Mass for calibration CRS
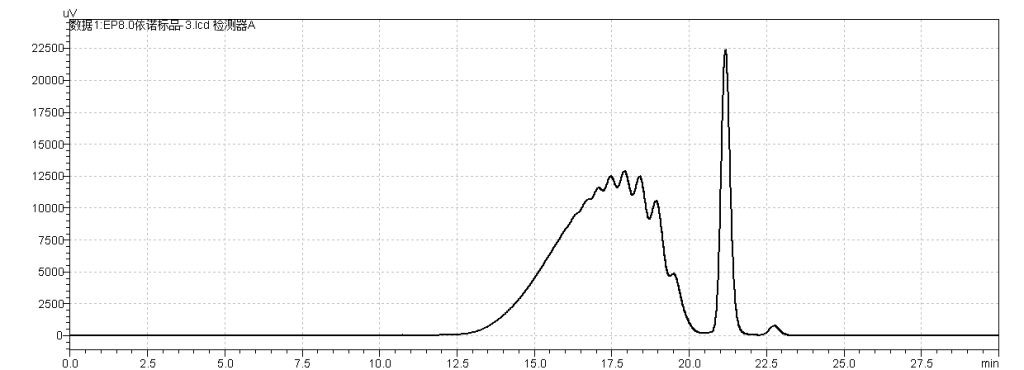
fig.12. Chromatogram of Enoxaparin sodium CRS
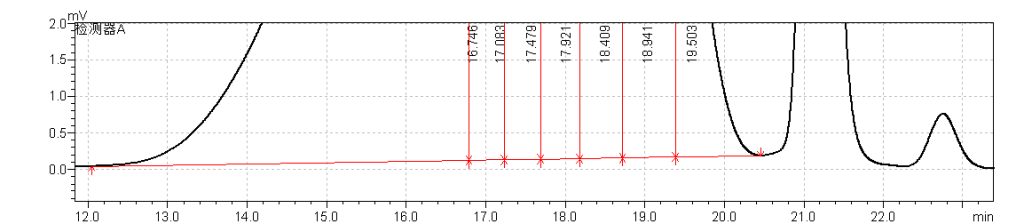
fig.13 Magnified Chromatogram of Enoxaparin sodium CRS
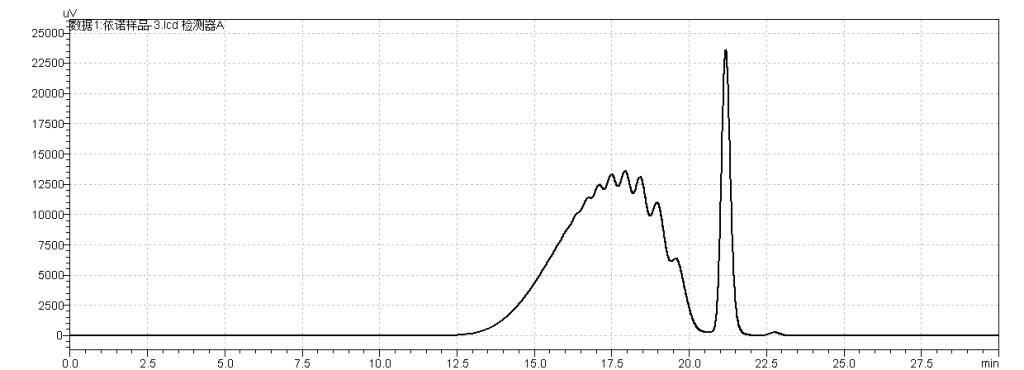
fig.14. Chromatogram of Sample
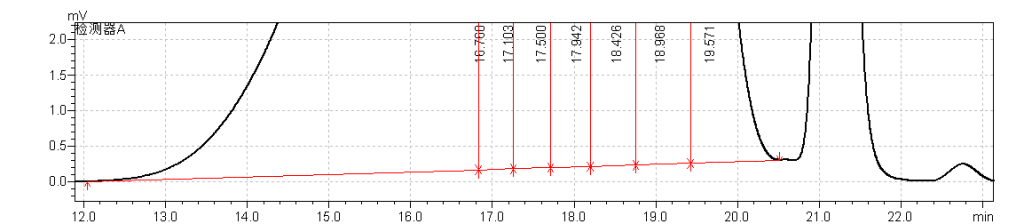
fig.15. Magnified Chromatogram of Sample
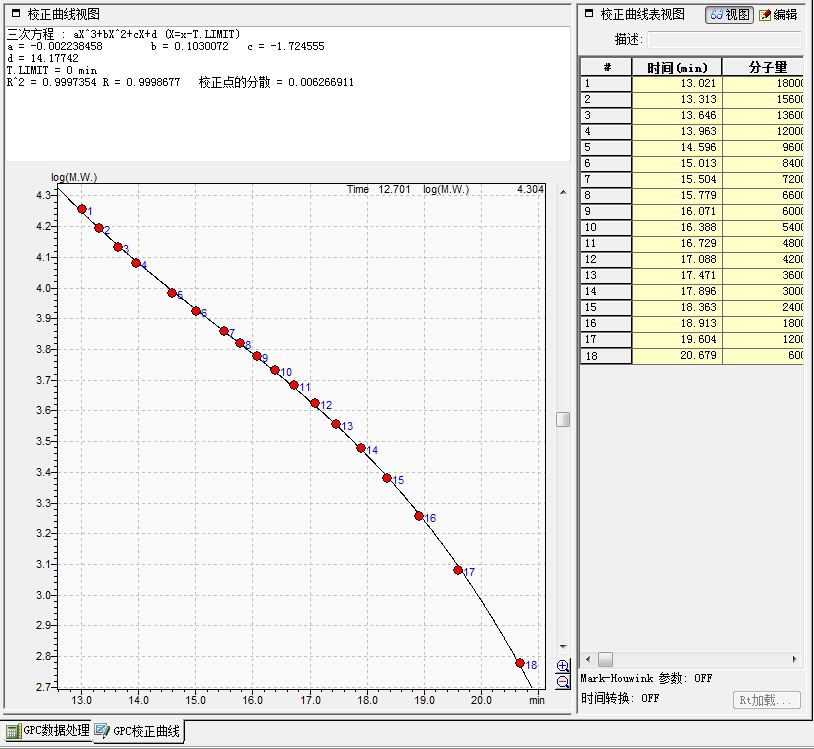
third-order polynomial equation : aX^3+bX^2+cX+d (X=x-T.LIMIT)
a = -0.002238458 b = 0.1030072 c = -1.724555
d = 14.17742
T.LIMIT = 0 min
R^2 = 0.9997354 R = 0.9998677 Dispersion of Calibration Points = 0.006266911
Table Experimental Results of Enoxaparin sodium sample
| Molecular Weight and Molecular Weight Distribution | Mw between 3800-5000Da。 | 4188Da |
| M<8000 between 75%-125%。 | 92% |